EMBL’s top social media posts of 2017 and what we learned from them
I want to take a look back at my first full year as EMBL’s social media manager. So what worked best over 2017 and what can I learn from this?
What are we measuring? Why?
My basic goals for EMBL’s social media are to build community and develop a shared understanding of who we as an organisation are. Consequently, I care about what resonates on the different social sites much more than driving traffic back to EMBL websites, although traffic is obviously a by-product.
Secondly, these posts are all categorised according to their reach (how many people saw the post) rather than by engagement (how many people reacted, liked, shared, clicked). That’s because these figures are easier to get and, crucially, make the data more comparable across channels. As things develop, we will need to reassess this.
Also note that the figures below are not normalised. All of our social channels have steadily grown in follower numbers since January 2017 and the algorithms have changed, so we can’t compare like with like, but we can notice trends.
Twitter top 5
We grew our twitter following from 6.8K to 10.7K and these were our top tweets:
1. Edith Heard
- Reach: 53K
- Engagement: 1.9K; 3.7%
2. Aid for labs
- Reach: 41K
- Engagement: 1.1K; 2.7%
3. EMBL Barcelona
- Reach: 31K
- Engagement: 1.5K; 4.8%
4. #EMBLcurious
- Reach: 26K
- Engagement: 295; 1.1%
5. Fotis Kafatos
- Reach: 21K
- Engagement: 488; 2.3%
These immediately demonstrate how twitter is not for clickthroughs. The top tweet, announcing our new Director General, was seen by over 50,000 people/accounts. Yet just over 500 people clicked the link in that tweet.
This also adds more evidence about the sort of people we are reaching on social media, as I described in my last post. Twitter is about news and the people following us are interested in EMBL and science news. We need to be there, but tweets need to stand alone, and the important info should be in each tweet’s text.
The second lesson that I draw from this is the importance both of resharing content that’s working well and using suitable hashtags for key events. For example, we shared several different tweets around the launch of EMBL Barcelona and in total more than 670K accounts were reached by something with the #EMBLBarcelona hashtag.
Facebook top 5
Our Facebook page likes increased from 12.4K to 16.3K in 2017 and these were our top 5 posts:
1. Science solidarity
- Reach: 58K
- Engagement: 2.2%
2. How do you say ‘science’?
- Reach: 37K
- Engagement: 2.4%
3. Seeing is understanding
- Reach: 33K
- Engagement: 1.3%
4. Bend and snip!
- Reach: 30K
- Engagement: 2.8%
5. Nobel laureate
- Reach: 25K
- Engagement: 4.3%
We don’t see crossover with our top posts on Facebook and Twitter, even though we often post the same content/stories on both channels. And as everyone was saying in 2017: video is king. However, with the recent changes announced with respect to the Facebook algorithm we will need to work even harder to ensure that what we post resonates with our community on Facebook, that we make it about the people and their values.
This is especially well evidenced by the “Mother tongue” video that was put together very quickly following a call to staff to submit videos sharing how they said science in their mother tongue and cut by our amazing colleagues in the photolab to be optimised for mobile. Sometimes, it’s not about the glossy corporate video, it’s about sharing and celebrating what EMBLers themselves make without any link to click through to. I’ll be exploring more of this in 2018.
Top 5 LinkedIn
In 2017, our LinkedIn page followers grew from 17K to 22K. Here are the top 5 LinkedIn updates:
1. Aid for labs
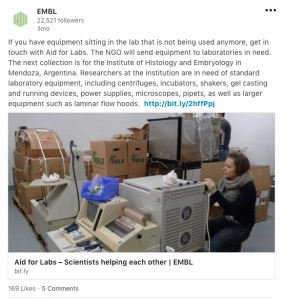
- Reach: 65K
- Engagement:0.97%
2. ISMB/ECCB
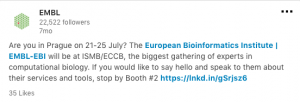
- Reach: 35K
- Engagement: 0.47%
3. Annabel Parret paper
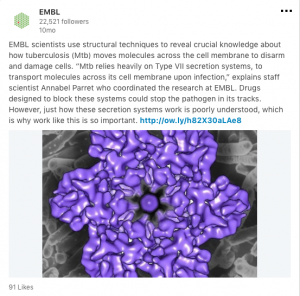
- Reach: 25K
- Engagement: 1.11%
4. Joep Muijrers
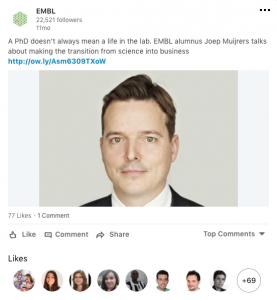
- Reach: 22K
- Engagement: 1.82%
5. James Sharpe
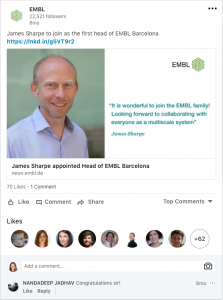
- Reach: 21K
- Engagement: 1.52%
This underlines the more professional nature of LinkedIn: people are interested in new starters and career advice. But the number of interactions (and hence our engagement rate) is lower here. That probably makes sense as LinkedIn tends to be less emotive. But for posts to do well here we need to resonate with the people who first see the post, so that it stands a chance of being pushed out to a wider audience.
I suspect LinkedIn is going to become even more useful in 2018 for EMBL to position itself as a leader in Life Science research and a place people want to be a part of. I’ve already had one useful meeting with HR about how we can use social better in 2018 and I suspect we could also collaborate more with the training teams to share snapshots of EMBL workshops and training sessions.
Instagram top 5
Started in 2016, our Instagram account grew from around 100 followers to 1.1K followers at the end of 2017. And the top 5 posts were:
Our best posts all gathered over 150 likes and were predominantly cell/microscopy images and staff reshares. Instagram is a highly curated platform and users prefer beautiful visual content and often post high-quality content themselves. With multiple sites and more stories than I can find and tell I’d like to move to a more user-generated content strategy on EMBL’s Instagram channel.
What would you like to see in 2018?
I’m aware that this overview is hardly rigorous data science, unlike a lot of the work that goes on at EMBL. Do you agree with what I think I’ve learned or do you draw other conclusions from the numbers? If you follow our accounts, what would you like to see there? And how would you like to get involved, if at all?