Spatio-temporal reconstruction of gene expression patterns in developing mice
Development 21/02/2025
10.1242/dev.204313
EMBL Barcelona researchers developed a new computational method to reconstruct embryonic development
From a single cell to an entire organism – embryonic development is a process of continuous and constant change. However, our understanding of this process is sometimes limited by the fact that we can only observe this process as ‘snapshots’, especially the finer molecular details, such as gene expression patterns.
Now, scientists from James Sharpe’s research group at EMBL Barcelona have found a way to visualise the continuous evolution of gene expression patterns in development, by applying a technique often used by video game developers. The study was published recently in the journal Development.
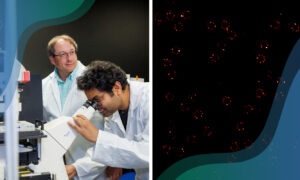
Here, Laura Aviñó-Esteban, PhD student in the Sharpe Group and the first author of the study, explains in her own words how the new discovery came about.
By Laura Aviñó-Esteban, Predoctoral Fellow, EMBL Barcelona
One of the biggest challenges in developmental biology is the inability to observe internal embryonic development in real time. In some animals, such as fish and amphibians, embryonic development takes place outside the parents’ bodies and researchers can directly take a movie of the process, but in mammals like mice the formation of organs only happens inside the uterus and thus remains hidden.
This forces researchers to rely on collecting snapshots of embryos at different stages if they want to study development. This approach, while useful, is inherently limited. It requires a large number of samples, and, despite the amount of data collected, still provides only a fragmented and noisy description of development.
Studying gene expression patterns is even more complicated. Unlike anatomical structures(like a bone or a particular tissue) gene expression patterns are not clearly linked to physical locations on the embryo, making it even harder to reconstruct how they change over time. Even with large datasets, variations between individual embryos – some developing faster, others slower – introduce inconsistencies that make interpretation difficult.
What we truly need is a continuous description of these dynamics, allowing us to visualise and even model a developing embryo’s gene expression patterns over time in a meaningful way.
This is precisely what we set out to achieve in the Sharpe Group, which studies limb development in mice. Our work uses previously collected datasets from different experiments and reconstructs a smooth, continuous timeline of gene expression patterns, filling the gaps in previous fragmented descriptions of embryonic development.
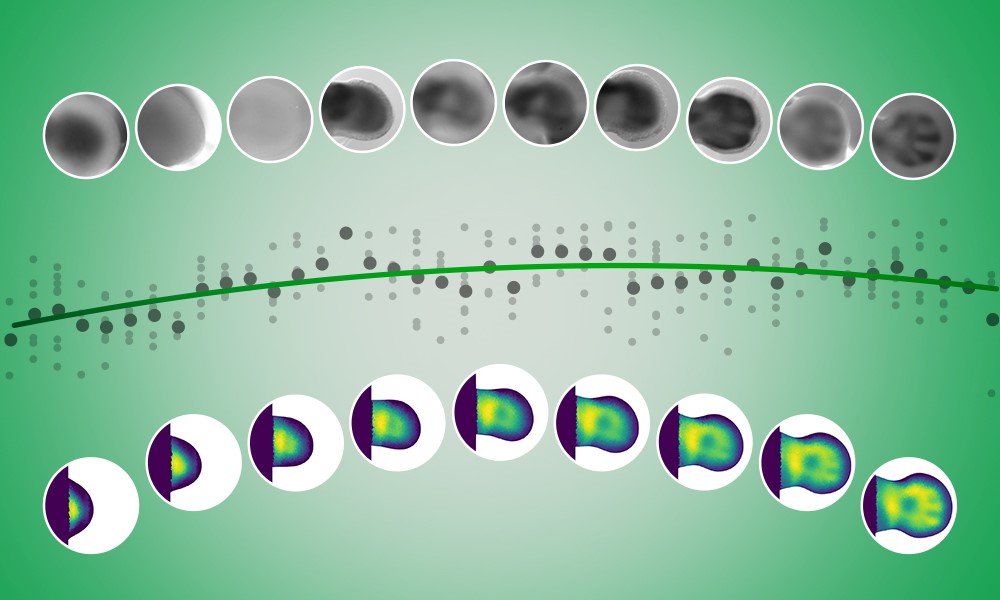
To do this, we developed a new method for ‘interpolating’ gene expression data — in other words, estimating the missing data points in the gaps between measurements. It’s like connecting dots on a graph, drawing lines to bridge the gaps and make the data complete.
Our method, instead of attempting to interpolate the entire pattern for a tissue directly – a complex and error-prone approach – focused on a simpler and more effective strategy: interpolating gene expression for each moving piece of tissue and then putting it together into a single representation of the developing limb. By transforming a difficult 2-dimensional problem into a more manageable 1-dimensional interpolation, we drastically improved both accuracy and efficiency.
During the development of this method, we encountered a key challenge: selecting the right interpolation technique. The two commonly used interpolation methods — linear and polynomial — each came with its own limitations. Linear interpolation, which connects the dots with straight lines, can lead to abrupt changes that feel unrealistic. On the other hand, polynomial interpolation creates smooth curves but requires guessing the exact shape of the curve in advance, which limits flexibility.
The breakthrough came from an unexpected source – video games! One evening, while playing, I realised that game developers use ‘something’ to create smooth yet flexible interpolations for camera movements and animations. I found that this ‘something’ is a set of mathematical functions known as B-Splines. This technique provided exactly what we needed: an interpolation method that was both arbitrary and smooth. By adopting B-splines, we were able to create a method that seamlessly integrates different sources of imaging data to generate a smooth reconstruction of gene expression patterns in time and space.
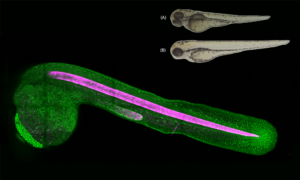
To test our method, we applied it to Sox9, a gene known to mark future skeletalcells during limb development. The results were promising – not only did we achieve the first clear visualisation of Sox9 expression over time, but we also demonstrated that the method works even for genes with very complex patterns. We also tested it on other developmental processes, such as neural tube formation – a key part of nervous system development – showing the broad applicability of the method beyond limb development.
Ultimately, we are very proud of this work. Our method addresses one of the most frustrating aspects of developmental biology: the inability to visualise gene expression changes dynamically. Even more importantly, we achieved this without requiring additional data collection.
Development 21/02/2025
10.1242/dev.204313