Mapping molecules on people, fields and ATMs
Standardised, freely available molecule mapping method is raising interest in forensics, agriculture and microbiome studies

This glowing avatar is a map of molecules. Every day, every inch of skin on your body comes into contact with thousands of molecules – from skin cream, sweat, even from the microbes that call your skin home. Now scientists can create interactive 3D maps that show where each molecule lingers on our bodies, thanks to a new method that researchers at EMBL and University of California San Diego have made available in Nature Protocols. When the team first used this approach to map the molecules on the skin of two volunteers, they found traces of sun cream and other hygiene products – three days after they’d last been used.
Theodore Alexandrov’s team at EMBL and Pieter Dorrestein’s at UC San Diego first developed the method to explore how molecules from our surroundings affect the microbe communities on our skin. Having been approached by colleagues from fields as diverse as forensics, cosmetics, ecology and agriculture, they have now made it into a step-by-step recipe and intuitive software.
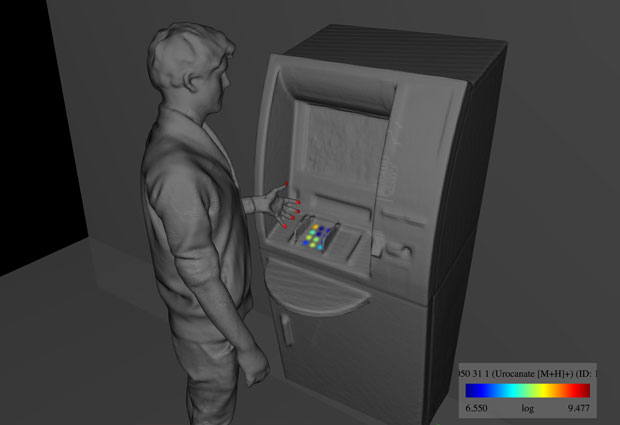
Can you guess which four digits a volunteer typed into the ATM machine in the image in the top header? If you guessed 8, 0, 1 and 7, you were right. The colour of the dots represents the amount of a molecule that was transferred from the person’s finger to the keypad. “There are much easier ways of stealing someone’s PIN,” says Alexandrov. “We had to first clean the ATM machine with methanol, then swab it and perform mass spectrometry, so it’s unlikely someone would steal your PIN this way. But it does show nicely that we transfer molecules from our skin to the objects we interact with – and that we can measure and map that. This has raised lots of interest from forensics experts.” In previous work, for instance, Alexandrov and Dorrestein were able to make predictions about people’s lifestyles based on the molecules found on their mobile phones.

“This is just a sprig of rosemary that we collected on campus at UC San Diego, but it demonstrates that the method can be applied to agriculture,” says Dorrestein. “You could use it to see if pesticides or other products applied to a field spread to neighbouring fields, and if there are patterns in that spread.” In this image, you can see that the old leaves at the bottom of the rosemary plant have much higher levels of the flavonoid cirsimaretin than the newer leaves at the top. Using maps like this, scientists can study how plants transport molecules from old leaves to young ones, or how they react to stress.
